This is false. [1] Real income has doubled since 1970 for individuals. I'm not sure why so many people seem to think that, I'm constantly having to reply to posts like this on HN and Reddit with real data but a lot of people just go along with it even though the people that post these claims never substantiate it with data.
I think there must be a psychological factor that makes people feel good about how our generation has it so hard? I would truly appreciate if someone could explain why.
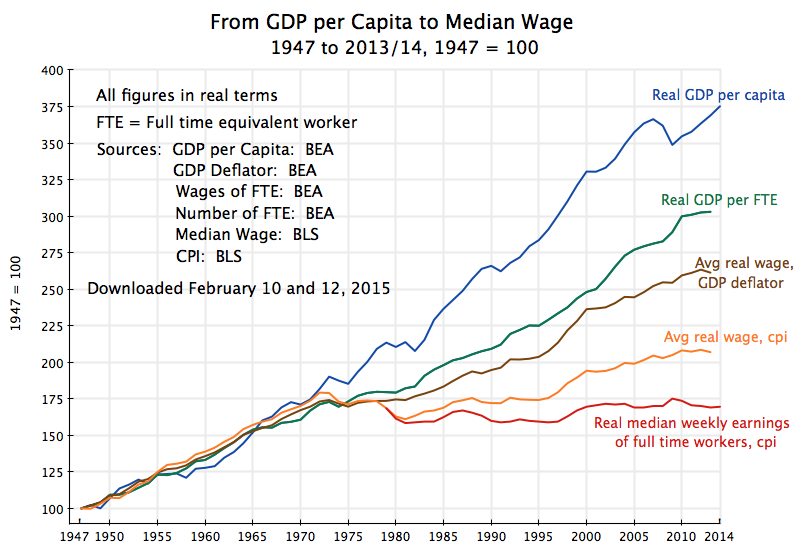
The general claim about 'Real Wage' stagnation is based on the median of full time workers. There is data for this in your link:
Men: 51,885 (1970) => 55,834 (2017), a 7.6% increase
Women: 30,733 (1970) => 44,379 (2017), a 41% increase
Also note that this data is using CPI-U-RS adjustment instead of CPI which is what is normally used for 'Real Wages'. There is some debate over the accuracy of CPI-U-RS, but it's worth noting that it's not directly calculated prior to 1978 so becomes more questionable. Comparing to 1978 your numbers are basically equal to 2017 income for men. For women there is still significant growth but I think it's hard to draw any conclusions since a very large number of women entered the full time workforce and took on higher level positions between 1970 and 2017.
I'm assuming you are getting 'doubled' by reading the per capita income data which is not a particularly accurate way to look at this. That is just taking the sum of the total income and dividing by the US population, i.e. it's a mean not a median. It's going to be skewed by high income individuals and also by the nature of labor force participation.
It would be interesting to see a graph over median wage similar to the one in the article, but with separate lines per gender.
> very large number of women entered the full time workforce and took on higher level positions between 1970 and 2017
If we look at US numbers that actually not the case. As I wrote in an other comment, between 1940 and 1970 it doubled from around 25% to around 50%, but from 1970 to 2017 it only went up to current 55%. It actually went down from 2000 which topped at 59%.
> If we look at US numbers that actually not the case. As I wrote in an other comment, between 1940 and 1970 it doubled from around 25% to around 50%, but from 1970 to 2017 it only went up to current 55%. It actually went down from 2000 which topped at 59%.
Using the data source provided from the post I replied to (table P-36) the number of full time, year-round workers looks like this:
Men: 36.1M (1970) => 66.4M (2017) increase of 84%
Women: 15.5M (1970) => 44.4M (2017) increase of 186%
So within this group we went from ~30% female to ~40% female and I would venture that the types of employment accessible to women in this time frame has also expanded quite a bit, though I have no immediate data handy to back this up.
Without digging into your numbers, I suspect they may come from total labor force participation which is a notably different metric.
Interesting. So, if women entered the workforce in greater numbers after 1970, and the median wage for women was lower, wouldn't that drag down the median for all workers? That is, if you took a population of the same percentage of women workers as you had in 1970, what would happen to the median wage in 2017?
Note well: This is not a plea for keeping women out of the workforce, or even out of the statistics. This is not an excuse for paying women less than men. This is merely noting that, in one respect, the comparison of 2017 to 1970 is not apples to apples.
Maybe you would have more luck if you cited better sources. I clicked on your link and just got a page of dozens of Excel files. Which one are you referring to?
On P7, it says median income in 2017 was $31,786. In 1974 (as far back as the data goes), median income in 2017 dollars was $23,984.
That's only a 32.5% increase, not 100% like you claim.
Per capita income doesn’t tell you about what went to generic “workers”. Nearly all of the income increase has gone to the top, and a higher percentage of adults are working now (most women have formal work now).
> The US uses a median figure for per capita income statistics
Do you have reference for this claim? That really wouldn’t make any sense. The appropriate technical term for median income is “median income”. “Per capita” always implies total divided by population, i.e. the mean.
> Per capita income is the mean income computed for every man, woman, and child in a particular group including those living in group quarters. It is derived by dividing the aggregate income of a particular group by the total population in that group.
Because medical costs, schooling costs, real housing costs etc, etc, etc have far more than doubled: merely adjusting for inflation is completely unrelated to change in cost of living.
It's like converting a bank account to Lira and thinking it makes you richer.
Interests rates are lower, so the sticker prices on tuition and housing and -- to some degree -- medical expenses are higher.
But how does CPI measure these things? It takes EVERYONE'S mortgage payments (which don't change anywhere near as much as sticker prices), lumps them together, and then takes the average. This makes sense. Mortgage payments (and rent) make up a huge percentage of most American's monthly payments.
Sticker prices on houses don't.
Inflation isn't meant to measure if things are getting more expensive for new homeowners (or any subset of the population). It's meant to measure if prices are increasing for the country as a whole. Just because houses cost double today what they did 8 years ago, it doesn't mean EVERYONE is paying double for housing.
If you took the sticker prices on houses (which is largely meaningless -- very few people buy houses in cash), this would be a metric that made people struggling to buy a house feel good. But it wouldn't help the Fed in anyway do its job of maintaining a steady rate of inflation so that we have a stable environment to invest in / allocate capital efficiently and effectively.
Yes, something needs to be done about housing market cycles and how much damage they cause to the economy. But putting sticker prices in inflation is not the solution.
I'm not positive how tuition is factored into CPI -- but I'm pretty certain it's a function of your loan payments.
The medical industry is batshit insane in this country, and I have absolutely no idea how this is measured. The only way I can think is that it's a function of how much you and your insurance pay for a bill. The sticker price on medical expenses is basically a made up number.
Although the CPI may need tweaks since it currently has a strange way of calculating housing calculations: not mortgage payments but rental of equivalent property, I still assume the CPI is fairly useful for guiding policy as is.
The problem is the grand-parent-post's use of this number to claim it indicates almost everyone, or at least "the typical person" is twice as well off now as 1973. And worse, doing so implies nothing needs to be fixed.
>Yes, something needs to be done about housing market cycles and how much damage they cause to the economy.
Housing market cycles do harm without fixing the underlying problem. They disrupt the larger economy but only shave of 10%-20% of home prices and then only temporarily. This failure to reduce housing costs is a problem.
Consider that in 1970 with a 30 year fixed at 8%, home prices sat at 65,000 adjusted for inflation. Rates were near double that in 80's yet, adjusted for inflation, homes were over 90k. Today, with about 4% interest, median price exceeds 250,000. Evidently total housing costs exceed wage and inflation over time. Evidently prices do not genuinely cycle. Evidently interest (our sole economic tool now) does not affect this overall trend.
So the issue arises in a generation or two. It seems there is magical thinking that history is over and this will just take care of itself and that mass ownership of land is somehow an inevitable law of nature. It seems more likely that the last 80 years were a fluke requiring careful maintenance which has ended.
>sticker prices on houses (which is largely meaningless -- very few people buy houses in cash)
The sticker price of a home directly relates to financed cost as well as cash.
Also bills for things that didn't used to exist: Internet, Cellphone, Cable/satellite tv, etc.
Not that those aren't luxuries, but for the most part they are considered to be part and parcel of modern living. California has free cellphones for poor people because it's considered a necessity.
Cable TV is certainly not a requirement for modern living, if fact its dying.
Cell / Internet I would agree are general requirements in the modern world for the most part. But it's also important to understand their impact on quality of life. There is a hugely understated value in the fact that an individual can have access to almost the entire knowledge base of humanity in the palm of their hand, and it's damn cheap for what it is. The closest comparison in 1970 would have been a full encyclopedia set which were actually pretty comparable in cost to a phone/laptop + internet service, yet obviously far more limited.
I know people who get by with only Cell. That's not enough for me (in fact I've gone through periods where I had internet but no cell), but I've seen people who make it work. It's a bit easier if you have a library nearby, or mainly only consume media, not produce it.
No, you're misreading the data. Comparing GDP, household incomes, real wages, total compensation, and household incomes is a non-trivial activity - it's easy to compare two numbers which are not actually directly comparable. Plus you have long-term factors such as an aging population, changing workforce participation, a shift from employers increasing wages to increasing benefits, and a larger share of wages going to the top 1% at the expense of everyone else. Combine that with increases in living costs which are typically not included in the measure of inflation, e.g. housing, and you've got a complex piece of data analysis to grapple with.
If you want to do a simple but meaningful ballpark comparison, compare total compensation with GDP [1]. It decreased by 4.5% from 1970 to 2016, meaning that workers are taking home a slightly smaller share of the "real" economy. Now recall that many costs have increased above the rate of inflation, e.g. housing, medical, education, so that money doesn't go as far as it used to.
Especially relevant here, since if all the income went to a single person, and everyone else was reduced to living under bridges, the average wage would stay the same.
Because a certain breed of politicians do a great disservice to the public by straight-up lying and deceiving the public.
```
In a country where no law can be voted, where no tax can be imposed, but with the consent of those whose dealings the law is to regulate, and whose pockets the tax is to affect, the public cannot be robbed without first being imposed on and misled. Our ignorance is the raw material of every extortion from which we suffer, and we may be certain beforehand that every fallacy is the precursor of an act of plunder.
```
I think there must be a psychological factor that makes people feel good about how our generation has it so hard? I would truly appreciate if someone could explain why.
https://www.census.gov/data/tables/time-series/demo/income-p...